CSRD: When ESG Becomes a Personal Risk. How Proof Architecture Shifts ESG from Sustainability to Accountability
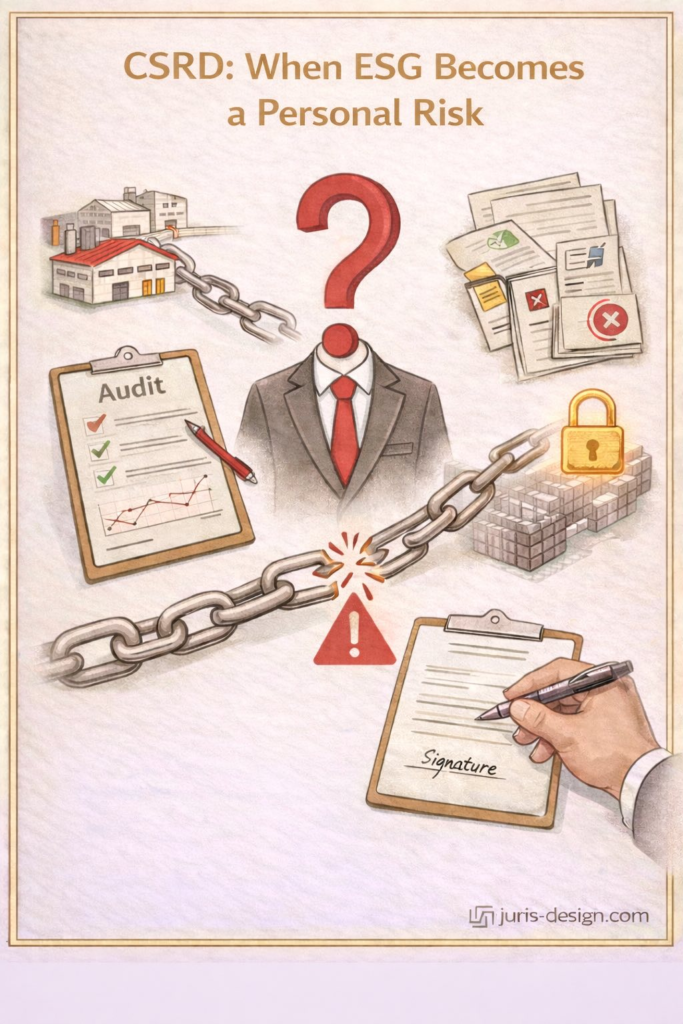
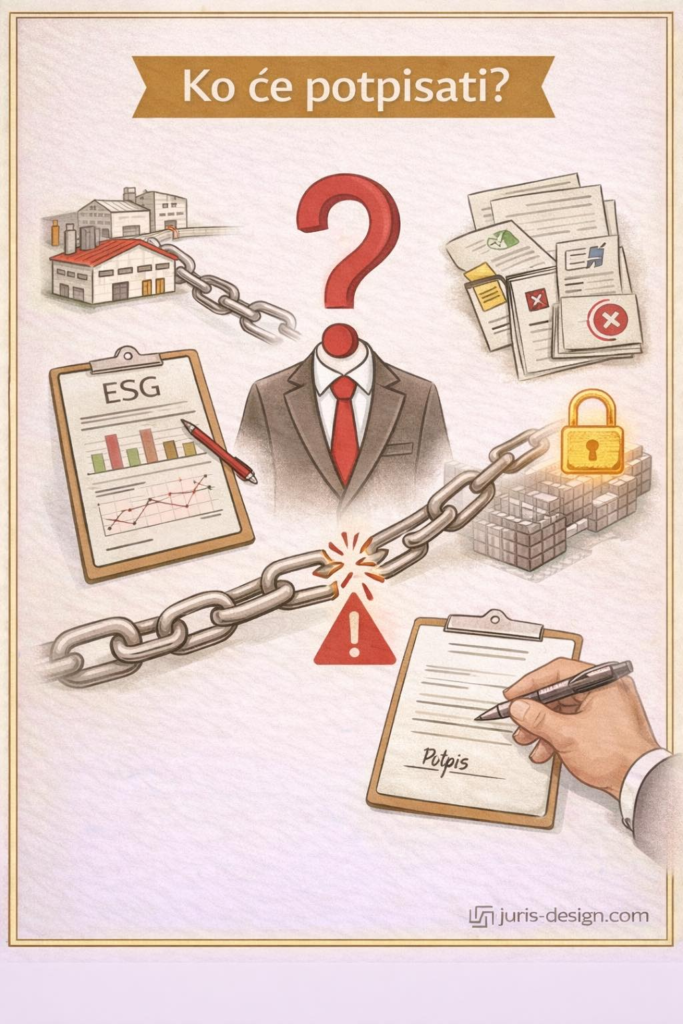
March has traditionally been about closing financial books. But starting in 2026, March carries a different weight for European and multinational companies. The key question will no longer be: “Are we profitable?” It will be: “Who is personally accountable for the accuracy of this ESG report?”
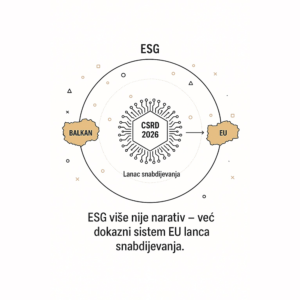
The Corporate Sustainability Reporting Directive (CSRD) does not simply expand sustainability reporting; it fundamentally shifts ESG from narrative disclosure to auditable accountability. For the C-suite, this is no longer a reporting task, it is a significant governance exposure.
From Communication to Governance Exposure
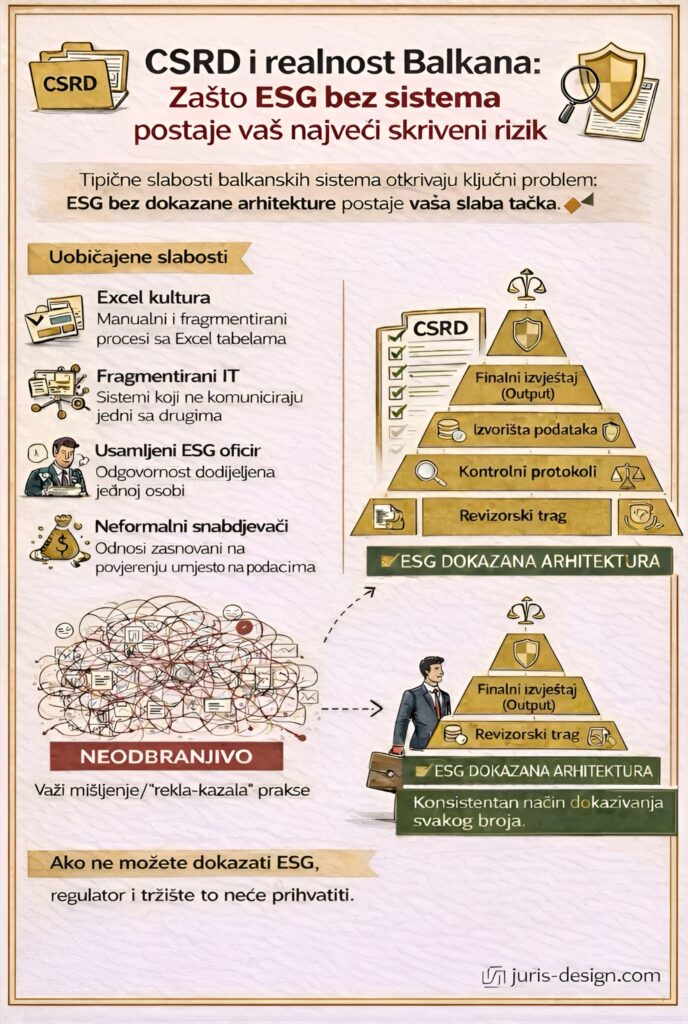
For years, ESG reporting has operated in a semi-structured space of fragmented systems and manual spreadsheets. CSRD changes the standard by making ESG data subject to mandatory assurance.
The challenge for most global organizations is the structural gap between their financial ERP systems and their ESG data needs. While a CFO can trust a ledger, they often cannot verify the "digital pedigree" of carbon emissions, water usage, or supply chain labor metrics. Under CSRD, the question is no longer: “Do we have the data?” It is: “Can we prove its origin-and who signed off on it?”
The End of Collective Ambiguity
In many organizations, ESG responsibility has been described as "cross-functional" or "shared." While collaboration is essential, collective ambiguity does not satisfy regulatory scrutiny.
As a legal professional, I see this as a massive liability trap. CSRD requires:
- Clearly identified signatories who take legal responsibility for the report.
- Documented internal controls equivalent to financial reporting standards (SOX-level discipline).
- Defined validation protocols (the "four-eyes" principle).
- A verifiable audit trail for every material metric.
If these elements are missing, auditors and regulators will not ask why the system was imperfect. They will ask who was responsible for ensuring it existed. This is where ESG becomes personal.
Double Materiality: The Liability Filter
CSRD introduces Double Materiality, requiring companies to report not only how sustainability issues affect them but also how they impact the world.
From a governance perspective, this acts as a liability filter. If a Board signs off on a report that ignores a significant impact in its value chain, it is no longer just a reporting error-it is a failure of oversight that creates direct governance risk. Double Materiality transforms ESG from a disclosure exercise into a governance exposure map.
Proof Architecture: The Executive Shield
Delegation does not equal protection. Without a defined methodology to track data from its origin to the final signature, the Board remains exposed.
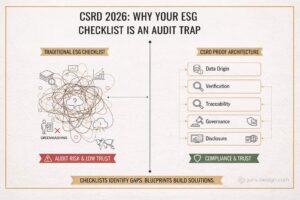
My methodology, Proof Architecture, is designed as a structural shield. It is not about more narrative; it is about documented integrity through five layers:
- Layer 1 – Data Origin: Responsibility at the point of creation (ERP, meters, HR records).
- Layer 2 – Verification: Independent validation and documented review processes.
- Layer 3 – Traceability: Digital logs demonstrating when and by whom data was modified.
- Layer 4 – Governance Sign-off: Defined authorization levels for reporting inclusion.
- Layer 5 – Disclosure Responsibility: Executive signatories fully aware of the supporting control environment.
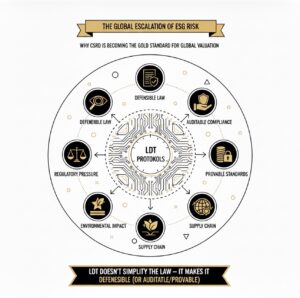
The Supply Chain Multiplier
CSRD compliance does not stop at the company boundary. Scope 3 emissions and human rights metrics introduce external dependency risk. A single key supplier with undocumented methodologies can compromise the integrity of your consolidated disclosures. Proof Architecture must extend into supplier contracts, communication standards, and verification protocols to protect the lead organization.
When the System Fails, Liability Becomes Visible
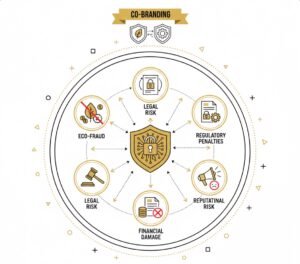
CSRD exposes three escalating risk layers:
- Operational Risk: Inconsistent or undocumented data flows.
- Reputational Risk: Adverse assurance opinions signaling governance weakness to markets.
- Governance Risk: Board-level accountability for insufficient internal controls.
CSRD does not penalize imperfection; it penalizes the absence of structured control.
The Question Every Board Should Ask in 2026
When the assurance provider asks: “Where did this number originate-and who validated it?”, will your organization have a documented answer? Or an explanation?
In 2026, the auditor's signature is not a stamp of approval for your sustainability story; it is a verification of your governance integrity.
If ESG cannot be proven, it cannot be defended. And if it cannot be defended, it becomes personal.
Other blogs

CSRD: When ESG Becomes a Personal Risk. How Proof Architecture Shifts ESG from Sustainability to Accountability
March was traditionally reserved for closing the financial books. But from 2026...
Ko će potpisati? CSRD i kraj kolektivne odgovornosti u regionalnim kompanijama
March in the Balkans is traditionally a month of final accounts. But in 2026, March brings…